261. Loki筆記
WHY
好記性,不如爛筆頭。
Note
-
Grafana Observerbility家族
- Grafana:提供強大可視化和監控功能的開源平台,支援多種數據來源和外掛,適用於構建各類儀表板。
- Prometheus:一個開源系統監控和警報工具,專門設計用來收集時序數據,並與 Grafana 整合,適合用於微服務架構的監控。
- AlertManager:Prometheus 的告警管理元件,負責處理告警的路由和通知,確保及時響應系統異常。
- Grafana Loki:專為日誌聚合設計的系統,能夠高效地收集和查詢日誌數據,並與 Grafana 無縫整合,適合用於微服務環境的日誌監控。
- Grafana Tempo:分佈式追蹤系統,專門設計用來追蹤和分析微服務之間的請求路徑,幫助識別性能瓶頸。
- Grafana Mimir:高可擴展的時序數據存儲系統,適合處理大規模監控數據的存儲需求,提供高效的查詢性能。
- Grafana Alloy:強化可觀測性的解決方案,專注於提供統一的數據聚合和分析能力,幫助使用者更好地理解和優化其應用性能。
ref. 後 Grafana 時代的第五天 - 探討 Grafana 大規模中心化架構的演變
-
Loki主要分成兩種檔案類型,一種是index,另一種是chunk。
前者作為索引目錄表,後者是儲存log。The index is a table of contents of where to find logs for a specific set of labels.
The chunk is a container for log entries for a specific set of labels在schema_config裡面代表的欄位為
store與object_store -
The simple scalable deployment mode can scale up to a few TBs of logs per day
helm部屬loki是採用簡單部屬,但簡單部屬已可達到每天TB等級的資料。
超過需要改用microservices。
ref. simple-scalable
- Promtail
Promtail is feature complete. All future feature development will occur in Grafana Alloy.
傳送資料時,
可先用dry-run驗證
cat my.log | promtail --stdin --dry-run --inspect --client.url http://127.0.0.1:3100/loki/api/v1/push
ref.
- loki語法查詢
|=(contains string) and!=(does not contain string) over the regular expression filter operators:|~(matches the regular expression)!~(does not match the regular expression)
- Explorer Logs
配合Loki好用的套件,可直接看到所有的Log。
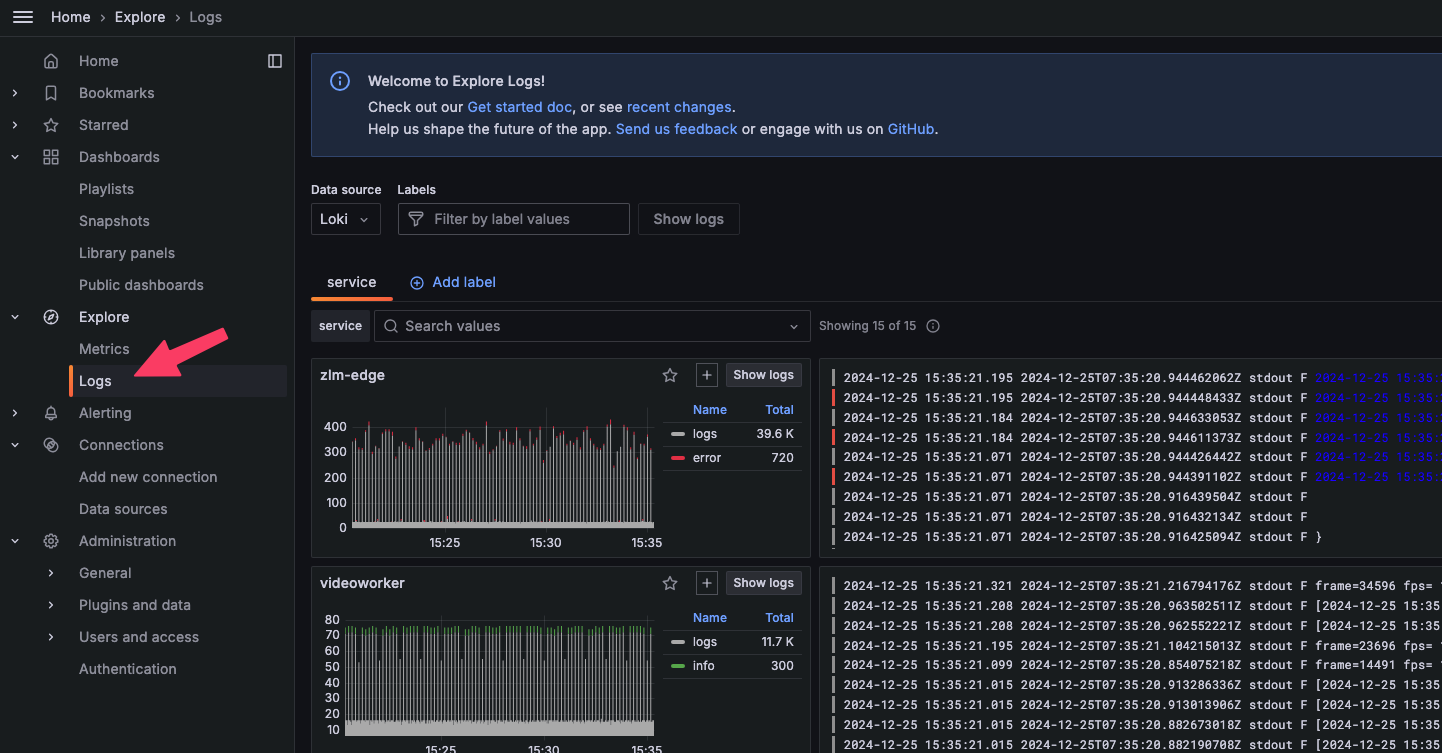
要使用Explore Logs](https://grafana.com/docs/loki/latest/visualize/grafana/#explore-logs),需更新到 Grafana 11.3。
- Loki可以無縫銜接使用新的儲存系統
以下是節錄自 Single Store TSDB (tsdb)
有兩個store的版本,假設今天是 2023-01-04 ,
可以指定 2023-01-05後,改使用另一個store。
schema_config:
  configs:
    # Old boltdb-shipper schema. Included in example for reference but does not need changing.
    - from: "2023-01-03" # <---- A date in the past
      index:
        period: 24h
        prefix: index_
      object_store: gcs
      schema: v12
      store: boltdb-shipper
    # New TSDB schema below
    - from: "2023-01-05" # <---- A date in the future
      index:
        period: 24h
        prefix: index_
      object_store: gcs
      schema: v13
      store: tsdb
...
- loki vs elastic search
loki的架構比較適合Low-cardinality。
elk則可以支援到 High-cardinality。
Low-cardinality表示一列有很多重複的值. 性別/姓名都算是低基數.
High-cardinality意味著該列包含很大比例的唯一值. 所以像UniqueID, UUID這樣的值在該列則能稱為高基數.
Loki 不對Log內容進行索引,僅索引Log的label。
ELK則會針對每個字段做索引,故可以用全文檢索。
-
ELK(Elasticsearch)適合場景:
- 需要對High-cardinality字段(如唯一 ID、IP 地址、用戶名等)進行查詢和分析。
- 支持複雜的全文檢索、聚合和篩選需求。
- 願意接受更高的存儲和運行成本。
-
Loki 適合場景:
- 重點是時間序列日志分析,標籤數量有限(Low-cardinality)。
- 不需要對日志的詳細字段進行高卡諾性查詢,而是更多關注基於時間範圍的日志搜索。
- Loki日誌保存
主要是下面這些。
limits_config:
  max_label_names_per_series: 20
  max_cache_freshness_per_query: 10m
  query_timeout: 300s
  reject_old_samples: true
  reject_old_samples_max_age: 168h
  split_queries_by_interval: 15m
  volume_enabled: true
  retention_period: 750h
compactor:
  working_directory: /var/loki/data/retention
  retention_enabled: true
  delete_request_store: filesystem
retention_enabled: 一定要設
delete_request_store:看是要刪除那邊的檔案,我的object_store使用filesystem。
retention_period:就看要保留多久了。
然後,loki的使用量真的低,prometheue使用量還比他高!?
ref. Log retention
- 大小寫忽略
在dashboard的時候,增加一個textbox供使用者查詢。
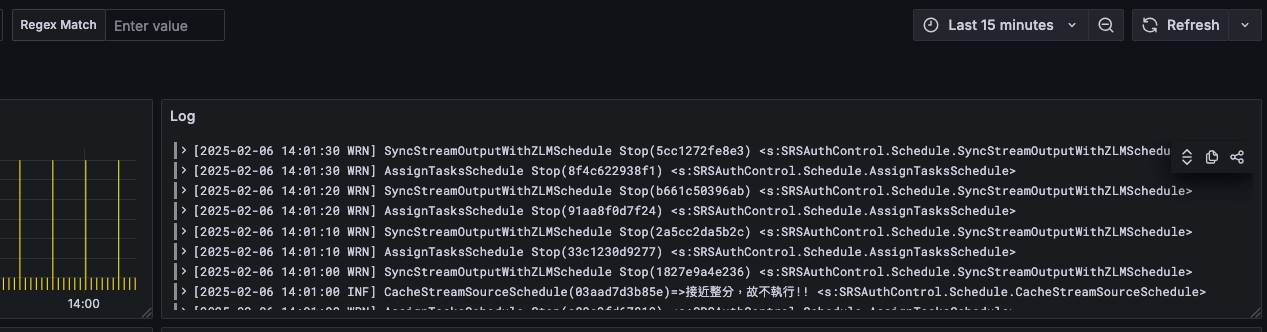
如果要搜尋多個字串的話,不能用 |= 要使用 |~ 正則表示。
忽略大小寫則是 (?i)
整合起來就是
{service_name=`control`} | json |~ "(?i)$search" | logfmt | drop __error__, __error_details__